Analyzing NYC MTA Data (Metis Project 1)
The Setup
In the first week of the Metis Bootcamp, we were assigned a group project. This project consisted of being hired by the WomenTechWomenYes (WTWY) organization to help organize a list of optimal flyering locations for their upcoming summer charity gala in NYC. The only requirement was that we had to utilize the MTA turnstile data provided through the NYC Open Data Portal.
In being a group project the group was immediately divided between the group that was going to handle the MTA data and people that were going to help merge that with outside data sources, I was assigned to the latter. As WTWY was an organization focused on increasing the amount of women in tech, we decided to first idealize the type of person that we would try to target to attend this gala.
Analysis
The Target: Becky
</b>

</b>
Meet Becky, she is 25 years old and both lives and works in New York City. Becky works as a software engineer for one of the top tech firms in the city and has a passion for dogs and coffee.
While theoretical as a person, Becky was the type of person we decided to target. With her characteristics we decided to focus on parameters associated with demographics, interests, and work to incorporate in order to maximize the number of Beckys. A designated corollary, corresponding data source, and scoring metric was summarized as below:
| Parameter | Corollary | Data Source | Scoring Metric |
|---|---|---|---|
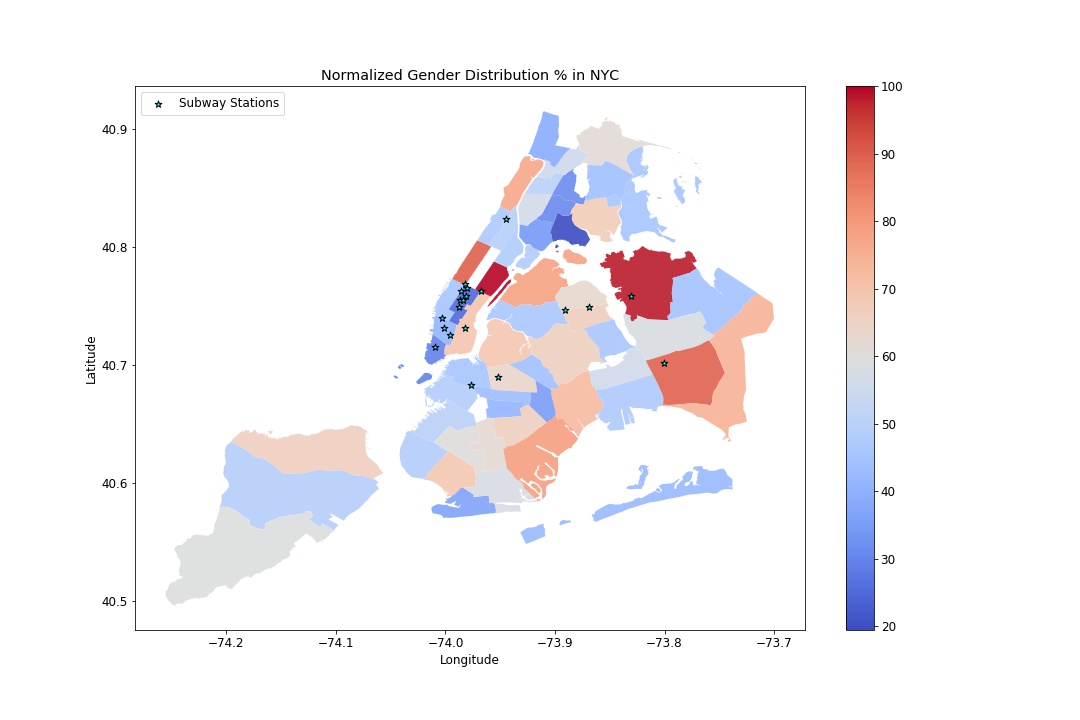
| Demographics | Gender Distribution | US Census 2010 Data | Number of women living in area |
| Interests | Starbucks | Google Maps API | Aggregate inverse distance to Starbucks locations within walking distance |
| Work | Tech Companies | Google Maps API | Aggregate inverse distance to top 21 tech companies |
Tools
Some of the tools that we were experiment with were the python-google-places and GeoPandas packages. Python-google-places was a wrapper developed by slimkrazy for the GooglePlaces API while GeoPandas was a nice tool used to plot spatial information.
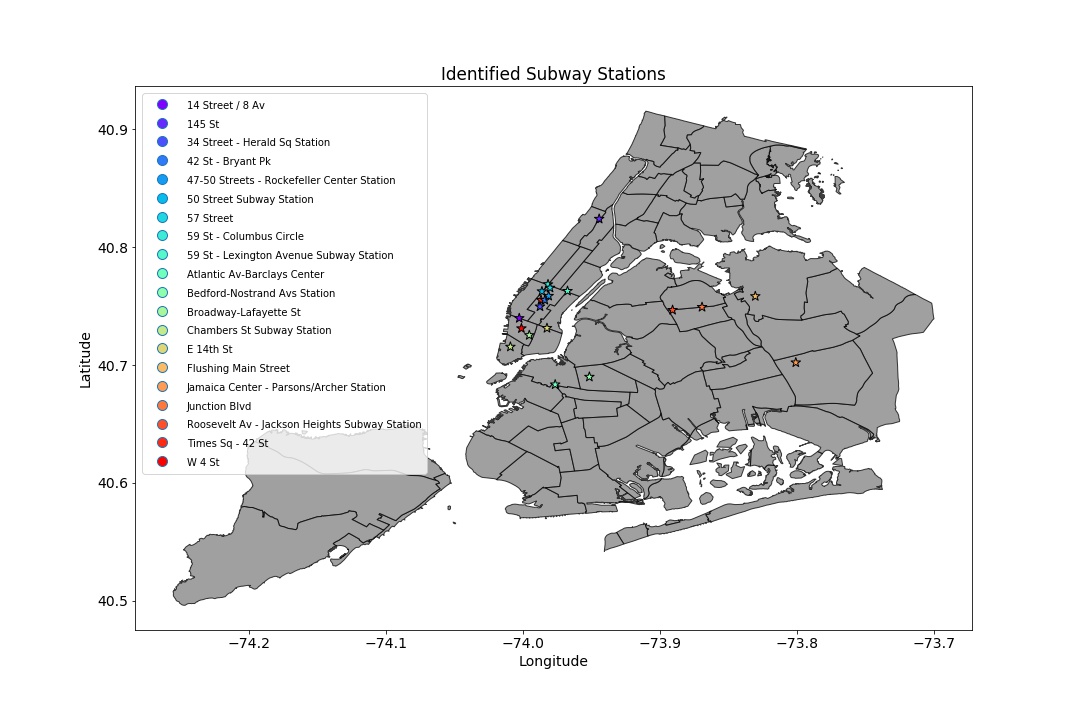
Identified Subway Stations
From the MTA data, the other half of the group was able to identify the following 20 subway stations to be of interest according to their analysis:

Gender Distribution

Starbucks
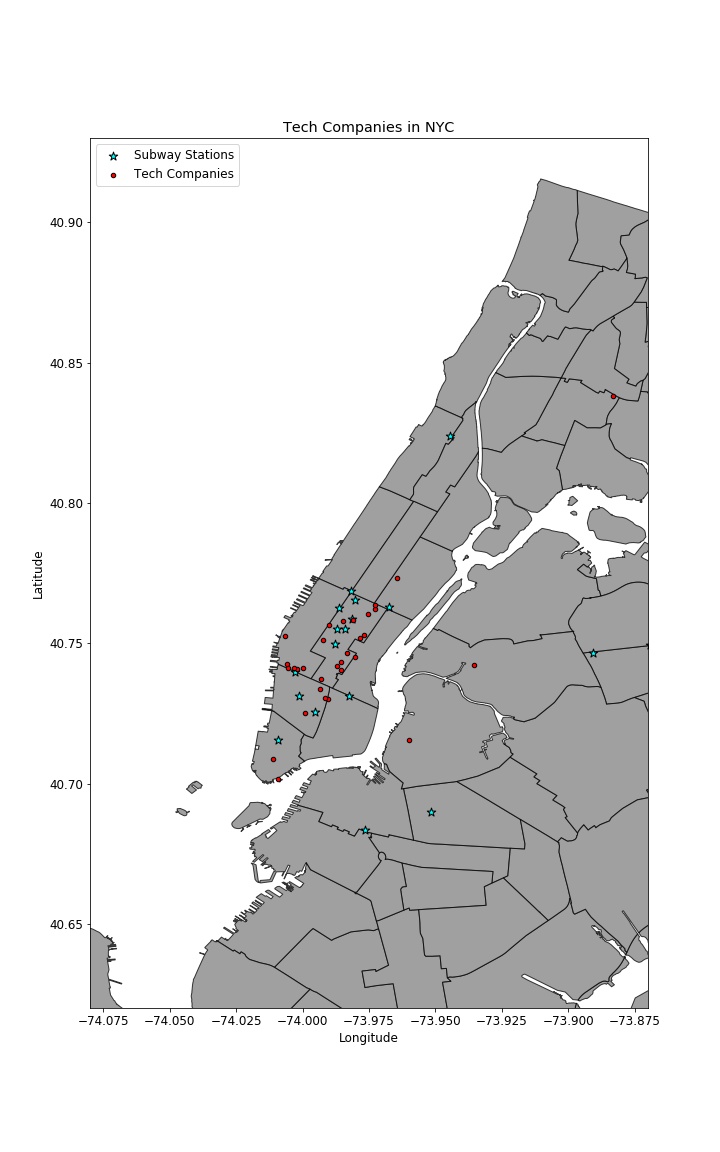
Tech Companies
From web scraping this article: Top 21 Tech Companies we were able to generate a list of 21 tech companies that we wanted to target in New York City. Utilizing the tech company names as key words to search on, we utilized the Google Maps and Google Places APIs to cross reference if locations existed in NYC and used the geocoordinates to generate the following map:

Results
Conclusion
Go to the place with the most people.
Recommendation
Modules Utilized
All jupyter notebooks and data contained at the following repo.
